Nursing homes in Texas: CMS ratings
Texas has 1,177 Medicare- or Medicaid-certified nursing homes with 133,481 certified beds in CMS data processed on October 1, 2026. CMS puts its average overall rating at 2.8 out of 5; the U.S. average is 3.0. 165 homes have the highest overall rating, 5 out of 5, and 288 homes have the lowest, 1 out of 5.
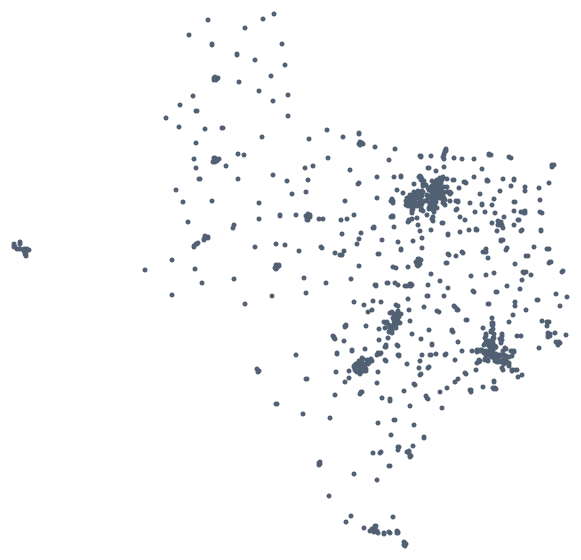
How Texas nursing homes are rated
- 5 out of 5, much above average 165 (14%)
- 4 out of 5, above average 214 (18%)
- 3 out of 5, average 245 (21%)
- 2 out of 5, below average 254 (22%)
- 1 out of 5, much below average 288 (24%)
- No overall rating 11 (under 1%)
All 165 five-star nursing homes in Texas
Texas compared with the U.S.
Averages across all nursing homes, as CMS publishes them in its State US Averages file.
| Measure | Texas | U.S. |
|---|---|---|
| Overall rating, out of 5 | 2.8 | 3.0 |
| Health inspection rating, out of 5 | 2.8 | 2.8 |
| Staffing rating, out of 5 | 1.9 | 3.0 |
| Quality measure rating, out of 5 | 3.8 | 3.7 |
| Health citations per home in the most recent inspection cycle | 9.6 | 9.2 |
| Fire safety citations per home in the most recent inspection cycle | 3.2 | 4.4 |
| Total nurse staffing, hours per resident per day | 3.42 | 3.90 |
| Registered nurse staffing, hours per resident per day | 0.44 | 0.69 |
| Total nurse staffing on the weekend, hours per resident per day | 2.99 | 3.43 |
| Total nursing staff turnover | 50.8% | 45.3% |
| Registered nurse turnover | 49.8% | 42.5% |
| Average number of residents per day | 75.9 | 85.7 |
| Fines per home | 1.4 | 0.9 |
| Fine amount per home | $42,987 | $30,351 |
CMS bases Five-Star quality ratings in the health inspection domain on the relative performance of facilities within a state.
That makes the health inspection rating, and the overall rating built on it, a comparison between nursing homes in the same state. Ratings in every state.
Texas nursing homes in numbers
- Nursing homes
- 1,177
- Certified beds
- 133,481
- Residents on an average day
- 88,856
- For profit ownership
- 829 (70%)
- Government ownership
- 244 (21%)
- Non profit ownership
- 104 (9%)
- Part of a chain
- 944 (80%)
- Homes fined
- 795 (68%)
- Total fines
- $50,596,177
- Payment denials
- 140
Fines and payment denials are for inspections between October 17, 2023 and September 23, 2026.
Homes with CMS's high-performing icon
61 nursing homes in Texas have a 5 out of 5 overall rating and CMS's high-performing icon. CMS describes the icon this way: "Exceeds the traditional five-star rating. Higher performing nursing homes have fewer citations (safety violations), higher staffing levels, and other quality indicators." The first 12 by city name are below; the five-star list has them all.
- Hendrick Skilled Nursing Facility
Abilene, TX
Health inspections 5, staffing 5, quality measures 5. 20 certified beds.
CMS high-performing icon.
- Wesley Court Health Center
Abilene, TX
Health inspections 4, staffing 3, quality measures 5. 30 certified beds.
CMS high-performing icon.
- Permian Residential Care Center
Andrews, TX
Health inspections 5, staffing 5, quality measures 2. 112 certified beds.
CMS high-performing icon.
- Longhorn Village
Austin, TX
Health inspections 4, staffing 5, quality measures 5. 60 certified beds.
CMS high-performing icon.
- The Arbour at Westminster Manor
Austin, TX
Health inspections 5, staffing 5, quality measures 5. 90 certified beds.
CMS high-performing icon.
- The Center at Parmer
Austin, TX
Health inspections 4, staffing 4, quality measures 5. 80 certified beds.
CMS high-performing icon.
- Bangs Nursing and Rehabilitation
Bangs, TX
Health inspections 5, staffing 4, quality measures 3. 48 certified beds.
CMS high-performing icon.
- Beaumont Health Care Center
Beaumont, TX
Health inspections 5, staffing 3, quality measures 3. 82 certified beds.
CMS high-performing icon.
- Brady West Rehab & Nursing
Brady, TX
Health inspections 4, staffing 3, quality measures 5. 106 certified beds.
CMS high-performing icon.
- Pecan Bayou Nursing and Rehabilitation
Brownwood, TX
Health inspections 4, staffing 3, quality measures 5. 90 certified beds.
CMS high-performing icon.
- Crestview Retirement Community
Bryan, TX
Health inspections 5, staffing 4, quality measures 5. 48 certified beds.
CMS high-performing icon.
- Brookdale Trinity Towers
Corpus Christi, TX
Health inspections 4, staffing 5, quality measures 5. 75 certified beds.
CMS high-performing icon.
Homes CMS has flagged in Texas
As of October 1, 2026, CMS lists 6 Special Focus Facilities, 30 candidates for that program and 111 homes with its abuse icon in Texas. What the Special Focus Facility program is.
Special Focus Facilities
- Viridian Wellness & Rehabilitation
Arlington, TX
204 certified beds.
CMS flags: Special Focus Facility
- Coral Rehabilitation and Nursing of Austin
Austin, TX
157 certified beds.
CMS flags: Special Focus Facility, Abuse icon
- Harmony Care at Beaumont
Beaumont, TX
98 certified beds.
CMS flags: Special Focus Facility, Abuse icon
- Paradigm at Woodwind Lakes
Houston, TX
180 certified beds.
CMS flags: Special Focus Facility
- Woodway Nursing & Rehab
Houston, TX
112 certified beds.
CMS flags: Special Focus Facility
- Terrell Healthcare Center
Terrell, TX
94 certified beds.
CMS flags: Special Focus Facility
Special Focus Facility candidates
- Avir at Corsicana Corsicana
- South Dallas Nursing & Rehabilitation Dallas
- Williamsburg Village Healthcare Campus Desoto
- Ignite Medical Resort El Paso, LLC El Paso
- DFW Nursing & Rehab Fort Worth
- Galveston Nursing and Rehabilitation Center Galveston
- Advanced Health & Rehab Center of Garland Garland
- Giddings Nursing and Rehabilitation Giddings
- Bear Creek Nursing and Rehabilitation Grapevine
- Afton Oaks Nursing and Rehabilitation Center Houston
- Avir at Arden Wood Houston
- Avir at Veterans Memorial Houston
- Eagle Crest Rapid Recovery Houston
- Fallbrook Rehabilitation and Care Center Houston
- Terra Bella Health and Wellness Suites Houston
- Deerbrook Skilled Nursing and Rehab Center Humble
- Whispering Pines Lodge Longview
- Kennedy Health & Rehab Lufkin
- Merkel Nursing Center Merkel
- Pleasant Springs Healthcare Center Mount Pleasant
- Shady Acres Health & Rehabilitation Newton
- Thrive Rehabilitation of Pearland Pearland
- Buena Vida Nursing and Rehab-San Antonio San Antonio
- Castle Hills Rehabilitation and Care Center San Antonio
- Normandy Terrace Nursing & Rehabilitation Center San Antonio
- San Antonio West Nursing and Rehabilitation San Antonio
- Paradigm at Sweeny Sweeny
- Reunion Plaza Senior Care and Rehabilitation Cente Texarkana
- Trinity Rehabilitation & Healthcare Center Trinity
- Avir at Rose Trail Tyler
Homes with the abuse icon
CMS's definition: "Cited for abuse or neglect at harm level or above on survey cycle 1 (Scope/severity G or greater) or cited for abuse or neglect at potential harm level (Scope/Severity D or above) on both survey cycles 1 and 2."
- Meridian Care of Alice Alice
- Hillside Heights Rehabilitation Suites Amarillo
- Avir at Athens Athens
- Avir at Commons Athens
- Austin Wellness & Rehabilitation Austin
- Avir at Park Bend Austin
- Coral Rehabilitation and Nursing of Austin Austin
- Riverside Nursing and Rehabilitation Center Austin
- Bastrop Lost Pines Nursing and Rehabilitation Cent Bastrop
- Avir at Beaumont Beaumont
- Harmony Care at Beaumont Beaumont
- Benbrook Nursing & Rehabilitation Center Benbrook
- Parkview Skilled Care and Rehabilitation Big Spring
- Brenham Nursing and Rehabilitation Center Brenham
- Bridgeport Medical Lodge Bridgeport
- Brookhaven Nursing and Rehabilitation Center Carrollton
- Heritage Gardens Rehabilitation and Healthcare Carrollton
- Focused Care of Center Center
- Cass Valley Healthcare Center Centerville
- Colonial Manor Nursing Center Cleburne
- Willow Park Rehabilitation Health Care Center Clifton
- Windsor Nursing and Rehabilitation Center of Morga Corpus Christi
- Avir at Corsicana Corsicana
- Capstone Healthcare of Daingerfield Daingerfield
- Fair Park Health & Rehabilitation Center Dallas
- Lakewest Rehabilitation and Skilled Care Dallas
- Le Reve Rehabilitation & Memory Care Dallas
- Skyline Nursing Center Dallas
- Del Rio Nursing and Rehabilitation Center Del Rio
- Denton Village by PureHealth Denton
- Park Village Healthcare and Rehabilitation Desoto
- Hidalgo Nursing and Rehabilitation Center Edinburg
- Paradigm at the Prairies El Campo
- Frank M. Tejeda Texas State Veterans Home Floresville
- Arbor Lake Nursing & Rehabilitation, LLC Fort Worth
- Avir at Fort Worth Fort Worth
- DFW Nursing & Rehab Fort Worth
- Downtown Health and Rehabilitation Center Fort Worth
- Estates Healthcare and Rehabilitation Center Fort Worth
- James L. West Center for Dementia Care Fort Worth
- Park View Care Center Fort Worth
- River Oaks Health and Rehabilitation Center Fort Worth
- Tuskegee Airmen Texas State Veterans Home Fort Worth
- Park Place Care Center Georgetown
- Giddings Nursing and Rehabilitation Giddings
- Graham Oaks Care Center Graham
- Windsor Healthcare Residence Groesbeck
- Meridian Care of Hebbronville Hebbronville
- Afton Oaks Nursing and Rehabilitation Center Houston
- Avir at Orem Houston
- Avir at Veterans Memorial Houston
- Champions Healthcare at Willowbrook Houston
- Eagle Crest Rapid Recovery Houston
- Jacinto Nursing and Rehabilitation Center Houston
- Memorial City Nursing and Rehabilitation Center Houston
- Park Manor of Cypress Station Houston
- St Dominic Village Rehabilitation and Nursing Cent Houston
- West Houston Rehabilitation and Healthcare Center Houston
- West Janisch Health Care Center Houston
- Deerbrook Skilled Nursing and Rehab Center Humble
- Focused Care at Humble Humble
- Ashford Hall Irving
- The Villages on MacArthur Irving
- Lakeside Health and Wellness Kemp
- Lone Star Ranch Rehabilitation and Healthcare Cent Kingsville
- Sylan Shores Health and Wellness La Porte
- Liberty Health Care Center Liberty
- Parkview Nursing and Rehabilitation Center Lockhart
- Kennedy Health & Rehab Lufkin
- Avir at Magnolia Luling
- Alfredo Gonzalez Texas State Veterans Home McAllen
- Briarcliff Nursing and Rehabilitation Center McAllen
- Merkel Nursing Center Merkel
- Palomino Place Mesquite
- Town East Rehabilitation and Healthcare Center Mesquite
- Avir at Mineola Mineola
- Mineola Gardens Wellness & Rehabilitation Mineola
- Focused Care at Mount Pleasant Mount Pleasant
- Pleasant Springs Healthcare Center Mount Pleasant
- Avir at New Braunfels New Braunfels
- Shady Acres Health & Rehabilitation Newton
- Avir at Overton Overton
- Ralls Nursing Home Ralls
- Richmond Health Care Center Richmond
- Park Valley Inn Health Center Round Rock
- San Gabriel Rehabilitation and Care Center Round Rock
- Avir at San Angelo San Angelo
- Buena Vida Nursing and Rehab-San Antonio San Antonio
- Patriot Heights Health Care Center San Antonio
- River City Care Center San Antonio
- Avir at Schertz Schertz
- Paradigm at the Oak Schulenburg
- Avir at Seguin Seguin
- Paradigm at Sweeny Sweeny
- Avir at Adams Temple
- William R Courtney Texas State Veterans Home Temple
- Countryview Nursing & Rehabilitation Terrell
- Avir at Texarkana Texarkana
- Seabreeze Nursing and Rehabilitation Texas City
- The Shoal Texas City
- Trinity Rehabilitation & Healthcare Center Trinity
- Avir at Petal Hill Tyler
- Park Place Nursing & Rehabilitation Center Tyler
- Focused Care of Waxahachie Waxahachie
- Avir at Weatherford Weatherford
- Focused Care at Webster Webster
- Regency Village Webster
- Parkview Manor Nursing and Rehabilitation Weimar
- Valley Grande Manor Weslaco
- Paradigm at the Creek Wharton
- Dogwood Trails Manor Woodville
Cities in Texas
Cities with three or more nursing homes, with the number in each.
- Abilene 11
- Alice 3
- Amarillo 12
- Arlington 9
- Athens 3
- Austin 25
- Bastrop 3
- Bay City 3
- Baytown 5
- Beaumont 9
- Bedford 4
- Big Spring 3
- Boerne 5
- Bonham 3
- Brenham 3
- Brownsville 7
- Brownwood 6
- Bryan 4
- Burleson 3
- Carrollton 5
- Carthage 3
- Cedar Park 4
- Center 3
- Cleburne 3
- College Station 3
- Conroe 4
- Corpus Christi 13
- Corsicana 5
- Crockett 3
- Dallas 33
- Decatur 3
- Del Rio 3
- Denison 5
- Denton 6
- Desoto 5
- Eagle Pass 3
- Edinburg 4
- El Paso 21
- Ennis 3
- Floresville 3
- Fort Worth 32
- Fredericksburg 4
- Frisco 3
- Gainesville 4
- Garland 6
- Granbury 4
- Grand Saline 3
- Grapevine 3
- Greenville 4
- Harlingen 7
- Houston 60
- Humble 6
- Huntsville 3
- Irving 6
- Jacksonville 3
- Katy 7
- Keller 3
- Kerrville 4
- Lampasas 3
- Lancaster 4
- Laredo 6
- League City 3
- Livingston 3
- Longview 9
- Lubbock 14
- Lufkin 6
- Luling 3
- Mansfield 3
- Marshall 3
- McAllen 8
- McKinney 5
- Mesquite 8
- Mexia 3
- Midland 5
- Missouri City 4
- Mount Pleasant 3
- Nacogdoches 3
- New Braunfels 5
- Odessa 6
- Palestine 4
- Paris 5
- Pasadena 8
- Pearland 4
- Plano 9
- Pleasanton 3
- Port Arthur 3
- Richardson 6
- Richmond 3
- Rockwall 4
- Rosenberg 3
- Round Rock 5
- San Angelo 8
- San Antonio 58
- San Augustine 3
- San Marcos 3
- Seguin 5
- Sherman 4
- Silsbee 3
- Stephenville 3
- Sugar Land 3
- Sulphur Springs 4
- Temple 10
- Terrell 3
- Texarkana 7
- Texas City 5
- The Woodlands 4
- Tomball 5
- Tyler 13
- Victoria 4
- Waco 13
- Waxahachie 3
- Weatherford 7
- Webster 3
- Weslaco 3
- Wichita Falls 7
Other cities and towns
Places with one or two nursing homes, listed by place name.
- Alamo: The Heights of Alamo
- Allen: Victoria Gardens of Allen
- Allen: The Belmont at Twin Creeks
- Alvarado: Alvarado Meadows Nursing & Rehabilitation
- Alvin: Laurel Court
- Alvin: The Lev at Winchester
- Andrews: Permian Residential Care Center
- Angleton: Cypress Woods Care Center
- Angleton: Country Village Care
- Aspermont: Stonewall Living Center
- Atlanta: Golden Villa
- Atlanta: Rose Haven Retreat
- Azle: Azle Manor Health Care, L.L.L.P.
- Baird: Avir at Baird
- Balch Springs: Balch Springs Nursing Home
- Ballinger: Central Texas Nursing & Rehabilitation
- Ballinger: Ballinger Healthcare and Rehabilitation Center
- Bandera: Cedar Creek Nursing and Rehabilitation Center
- Bandera: Avir at Bandera
- Bangs: Bangs Nursing and Rehabilitation
- Bartlett: Will-O-Bell
- Bee Cave: Park Manor Bee Cave
- Beeville: Hacienda Oaks at Beeville
- Beeville: Avir at Beeville
- Bellmead: The Atrium of Bellmead
- Bellville: Avir at Bellville
- Belton: Creekside Terrace Rehabilitation
- Belton: Avir at Belton
- Benbrook: Benbrook Nursing & Rehabilitation Center
- Bertram: Bertram Nursing and Rehabilitation
- Big Lake: Reagan County Care Center
- Booker: Twin Oaks Manor
- Borger: Avir at Borger
- Borger: Caprock Nursing & Rehabilitation
- Bowie: Advanced Rehabilitation and Healthcare of Bowie
- Brady: Brady West Rehab & Nursing
- Breckenridge: Villa Haven Health and Rehabilitation Center
- Bremond: Bremond Nursing and Rehabilitation Center
- Bridgeport: Bridgeport Medical Lodge
- Bronte: Bronte Health and Rehab Center
- Brookshire: Brookshire Nursing and Rehabilitation
- Brownfield: Apex Secure Care Brownfield
- Brownfield: Brownfield Rehabilitation and Care Center
- Bullard: Bluebonnet Point Wellness
- Burkburnett: Avir at Burkburnett
- Burkburnett: Sheridan Medical Lodge
- Burnet: Avir at Burnet
- Caldwell: Avir at Caldwell
- Caldwell: Copperas Hollow Nursing & Rehabilitation Center
- Cameron: Winnie L Nursing & Rehabilitation
- Cameron: Legacy Nursing and Rehabilitation
- Camp Wood: Avir at Camp Wood
- Canadian: Mesa View Senior Living
- Canton: Canton Oaks
- Carrizo Springs: Whispering Springs Rehabilitation and Healthcare C
- Castroville: Medina Valley Health & Rehabilitation Center
- Cedar Hill: Cedar Hill Healthcare Center
- Cedar Hill: Crestview Court
- Celina: Settlers Ridge Care Center
- Centerville: Cass Valley Healthcare Center
- Chandler: Chandler Nursing Center
- Childress: Avir at Childress
- Cisco: Avir at Cisco
- Clarendon: Clarendon Nursing Home
- Clarksville: Focused Care at Clarksville
- Clarksville: Clarksville Nursing Center
- Claude: Palo Duro Nursing Home
- Cleveland: Cleveland Health Care Center
- Clifton: Willow Park Rehabilitation Health Care Center
- Clifton: Sunset Home
- Clute: Woodlake Nursing Center
- Clyde: Clyde Nursing Center
- Coleman: Coleman Healthcare Center
- Coleman: Holiday Hill Inc
- Colorado City: Mitchell County Nursing and Rehabilitation Center
- Columbus: Columbus Oaks Healthcare Community
- Columbus: Trucare Living Centers-Columbus
- Comanche: Western Hills Healthcare Residence
- Comanche: Legacy Estate Long Term Care
- Comfort: Avir at Comfort
- Commerce: Avir at Commerce
- Converse: Avir at Converse
- Cooper: Birchwood Nursing and Rehabilitation
- Coppell: Sandy Lake Rehabilitation and Care Center
- Copperas Cove: Copperas Cove Nursing & Rehabilitation
- Copperas Cove: Hill Country Heights
- Corinth: Corinth Rehabilitation Suites on the Parkway
- Corrigan: Corrigan LTC Partners
- Cotulla: Avir at Cotulla
- Crane: Focused Care at Crane
- Crosbyton: Crosbyton Nursing and Rehabilitation Center
- Crowell: Crowell Nursing Center
- Crowley: Crowley Nursing and Rehabilitation
- Crowley: Allegiant Wellness and Rehab
- Cuero: Cuero Nursing and Rehabilitation Center
- Cuero: Whispering Oaks Rehab & Nursing
- Cypress: Cypress Creek Rehabilitation and Healthcare Center
- Daingerfield: Capstone Healthcare of Daingerfield
- Dalhart: Coon Memorial Home
- Dayton: Dayton Nursing and Rehabilitation
- De Leon: De Leon Nursing and Rehabilitation
- Denver City: Shinnery Oaks Community
- Devine: Devine Health & Rehabilitation
- Diboll: Diboll Nursing and Rehab
- Dimmitt: Castro County Nursing & Rehabilitation
- Dimmitt: Country View Living
- Dripping Springs: Avir at Dripping Springs
- Dumas: Memorial Nursing and Rehabilitation Center
- Dumas: Great Plains Nursing and Rehabilitation
- Duncanville: The Laurenwood Nursing and Rehabilitation
- Duncanville: Duncanville Healthcare and Rehabilitation Center
- Eagle Lake: Arbor Hills Rehabilitation and Healthcare Center
- Eastland: Avir at Woodlands
- Eden: Concho Health & Rehabilitation Center
- Edna: Southbrooke Manor Nursing and Rehabilitation Cente
- El Campo: Paradigm at the Prairies
- El Campo: S.P.J.S.T. Rest Home 3
- Eldorado: Schleicher County Medical Center
- Electra: Electra Healthcare Center
- Elgin: Elgin Nursing and Rehabilitation Center
- Elkhart: Avir at Elkhart
- Emory: Emory Health and Rehab
- Euless: Westpark Rehabilitation and Living
- Fairfield: Fairview Healthcare Residence
- Fairfield: Fairfield Nursing & Rehabilitation Center
- Falfurrias: Gulf Shores Rehabilitation and Healthcare Center
- Farmersville: Lexington Medical Lodge
- Farmersville: Farmersville Health and Rehabilitation
- Farwell: Farwell Care and Rehabilitation Center
- Flatonia: Flatonia Healthcare Center
- Flower Mound: Cross Timbers Rehabilitation and Healthcare Center
- Flower Mound: Hollymead
- Forney: Ridgecrest Healthcare and Rehabilitation Center
- Fort Stockton: Focused Care at Fort Stockton
- Franklin: Franklin Nursing Home
- Friendswood: Friendship Haven Healthcare and Rehabilitation Cen
- Friona: Prairie Acres
- Galveston: Galveston Nursing and Rehabilitation Center
- Galveston: The Meridian
- Ganado: Ganado Nursing and Rehabilitation Center
- Garrison: Garrison Nursing Home & Rehabilitation Center
- Gatesville: Hillside Medical Lodge
- Gatesville: Coryell Health Rehabliving at the Meadows
- George West: Live Oak Nursing and Rehabilitation Center
- Georgetown: Park Place Care Center
- Georgetown: Georgetown Nursing and Transitional Care
- Giddings: Avir at Giddings
- Giddings: Giddings Nursing and Rehabilitation
- Gilmer: Focused Care of Gilmer
- Gilmer: Gilmer Nursing & Rehabilitation
- Gladewater: Truman W Smith Children's Care Center
- Gladewater: Legend Oaks Healthcare and Rehabilitation Center G
- Glen Rose: Cherokee Rose Nursing & Rehabilitation
- Glen Rose: Glen Rose Nursing and Rehab Center
- Goldthwaite: Avir at Hillview
- Goldthwaite: Goldthwaite Health & Rehab Center
- Goliad: La Bahia Nursing & Rehabilitation
- Gonzales: Avir at Gonzales
- Gonzales: The Heights of Gonzales
- Graham: Avir at Graham
- Graham: Graham Oaks Care Center
- Grand Prairie: Heritage at Turner Park Health & Rehab
- Grandview: Grandview Nursing and Rehabilitation Center
- Groesbeck: Windsor Healthcare Residence
- Groesbeck: Groesbeck LTC Nursing and Rehabilitation
- Groves: Magnolia Manor
- Groves: Oak Grove Nursing Home
- Groveton: Groveton Nursing Home
- Hallettsville: Hallettsville Nursing and Rehabilitation Center
- Hallettsville: Stevens Nursing and Rehabilitation Center of Halle
- Hamilton: Pecan Creek Healthcare Center
- Hamilton: Focused Care at Hamilton
- Hamlin: Homeplace Manor Healthcare Center
- Harker Heights: Harker Heights Nursing & Rehabilitation
- Haskell: Avir at Haskell
- Hearne: Crossroads Nursing & Rehabilitation
- Hebbronville: Meridian Care of Hebbronville
- Hemphill: Hemphill Care Center
- Hemphill: Legacies Nursing and Rehabilitation
- Henderson: Henderson Health & Rehabilitation Center
- Henderson: Autumn Leaves Nursing and Rehab Inc
- Henrietta: Grace Care Center of Henrietta
- Hereford: Hereford Nursing & Rehabilitation
- Hewitt: Hewitt Nursing and Rehabilitation
- Hico: Hico Nursing and Rehabilitation
- Highland Village: Rambling Oaks Courtyard Extensive Care Community
- Hillsboro: Avir at Hillsboro
- Hillsboro: Town Hall Estates
- Hondo: Community Care Center of Hondo
- Honey Grove: Honey Grove Nursing Center
- Horseshoe Bay: The Brixton at Horseshoe Bay
- Hughes Springs: Capstone Healthcare of Hughes Springs
- Huntington: Huntington Health Care & Rehabilitation Center
- Hurst: Oakmont Guest Care Center
- Hurst: Hurst Plaza Nursing and Rehab
- Hutto: Falcon Ridge Rehabilitation
- Italy: Renaissance Rehabilitation and Healthcare Center
- Itasca: Avir at Itasca
- Jacksboro: Avir at Jacksboro
- Jasper: Timberidge Nursing and Rehabilitation Center
- Jasper: Rayburn Health Care & Rehabilitation
- Jayton: Kent County Nursing Home
- Jefferson: Avir at Jefferson
- Johnson City: Avir at Johnson City
- Jourdanton: Jourdanton Nursing and Rehabilitation
- Justin: Longmeadow Healthcare Center
- Karnes City: Bluebonnet Nursing & Rehabilitation
- Kaufman: Avir at Kaufman
- Kaufman: Sunflower Park Health Care
- Keene: Town Hall Estates Keene Inc
- Kemp: Kemp Care Center
- Kemp: Lakeside Health and Wellness
- Kenedy: John Paul II Nursing Home
- Kenedy: Kenedy Health & Rehabilitation
- Kennedale: Avir at Kennedale
- Kerens: Kerens Care Center
- Kilgore: Arbor Grace Guest Care Center
- Kilgore: Willow Rehab & Nursing
- Killeen: Rosewood Heights
- Killeen: Avir at Killeen
- Kingsland: Avir at Kingsland
- Kingsville: Lone Star Ranch Rehabilitation and Healthcare Cent
- Kingsville: Kingsville Nursing and Rehabilitation Center
- Kingwood: Kingwood Rehabilitation and Healthcare Center
- Kirbyville: Avalon Place Kirbyville
- Knox City: Avir at Knox City
- Kountze: Paradigm at Kountze
- Kyle: Legend Oaks Healthcare and Rehabilitation-Kyle
- La Grange: Monument Hill Nursing and Rehabilitation Center
- La Grange: Avir at La Grange
- La Marque: Bayou Pines Care Center
- La Porte: Bay Ridge Healthcare Center
- La Porte: Sylan Shores Health and Wellness
- La Vernia: Country Care Manor
- Lake Jackson: Brazos Healthcare Center
- Lake Jackson: Oak Village Healthcare
- Lake Worth: Lake Lodge Nursing & Rehabilitation
- Lakeway: Vista Ridge Senior Care
- Lamesa: Focused Care at Lamesa
- Levelland: Lynwood Nursing and Rehabilitation
- Levelland: Levelland Nursing and Rehabilitation Center
- Lewisville: Lake Village Nursing and Rehabilitation Center
- Lewisville: Vista Ridge Nursing & Rehabilitation Center
- Liberty: Liberty Health Care Center
- Liberty: Magnolia Place Health Care
- Lindale: Colonial Nursing & Rehabilitation Center
- Lindale: Avir at Lindale
- Linden: Focused Care at Linden
- Littlefield: Sunset Valley Rehabilitation and Healthcare Center
- Live Oak: Advanced Rehabilitation & Healthcare of Live Oak
- Llano: Llano Nursing and Rehabilitation Center
- Lockhart: Chisolm Trail Nursing and Rehabilitation Center
- Lockhart: Parkview Nursing and Rehabilitation Center
- Lumberton: Village Creek Rehabilitation and Nursing Center
- Lytle: Lytle Nursing Home
- Mabank: Mabank Nursing Center
- Madisonville: Madisonville Care Center
- Madisonville: Avir at Madisonville
- Magnolia: The Heights of Magnolia
- Malakoff: Cedar Lake Nursing Center
- Manchaca: Marbridge Villa
- Marble Falls: Granite Mesa Health Center
- Marlin: Golden Years Nursing and Rehabilitation Center
- Matador: Matador Health and Rehabilitation Center
- Mathis: Palma Real
- Mc Gregor: McGregor Wellness & Rehabilitation
- McCamey: McCamey Convalescent Center
- McGregor: St. Joseph's Care Center
- Mclean: McLean Care Center
- Memphis: Memphis Convalescent Center
- Menard: Menard Manor
- Mercedes: Mid Valley Nursing & Rehabilitation
- Meridian: The Hilltop on Main
- Merkel: Merkel Nursing Center
- Midlothian: Midlothian Healthcare Center
- Midlothian: Midtowne Meadows Health & Rehab
- Mineola: Avir at Mineola
- Mineola: Mineola Gardens Wellness & Rehabilitation
- Mineral Wells: Mineral Wells Nursing & Rehabilitation
- Mineral Wells: Palo Pinto Nursing Center
- Mission: Mission Nursing and Rehabilitation Center
- Mission: Mission Valley Nursing and Transitional Care
- Monahans: Avir at Monahans
- Mont Belvieu: Mont Belvieu Rehabilitation & Healthcare Center
- Moulton: Shady Oak Nursing and Rehabilitation
- Mount Vernon: Cypress Springs Wellness & Rehabilitation
- Muleshoe: Park View Nursing Care Center
- Munday: Munday Nursing Center
- Navasota: Navasota Nursing & Rehabilitation
- Navasota: Golden Creek Healthcare and Rehabilitation Center
- Needville: S.P.J.S.T. Rest Home No 2
- Newton: Shady Acres Health & Rehabilitation
- Nocona: Nocona Rehabilitation and Care Center
- North Richland Hills: Glenview Wellness & Rehabilitation
- North Richland Hills: Avir at Emerald Hills
- Olney: Olney Rehabilitation and Care Center
- Olton: Runningwater Draw Care Center, Inc.
- Orange: Focused Care at Orange
- Overton: Avir at Overton
- Ozona: Crockett County Care Center
- Pampa: Avir at Pampa
- Pampa: Pampa Nursing Center
- Pearsall: Pearsall Nursing and Rehabilitation Center
- Pecos: Avir at Pecos
- Penitas: Las Alturas de Penitas
- Perryton: Capstone Healthcare of Perryton
- Pflugerville: Five Points of Pflugerville
- Pflugerville: Pflugerville Nursing and Rehabilitation Center
- Pharr: Colonial Manor Advanced Rehab & Healthcare
- Pilot Point: Cedar Ridge Rehabilitation and Healthcare Center
- Pilot Point: Avir at Pilot Point
- Pittsburg: Avir at Pittsburg
- Plainview: Plainview Healthcare Center
- Plainview: Prairie House Living Center
- Port Lavaca: Port Lavaca Nursing and Rehabilitation Center
- Port Lavaca: Lavaca Bay Nursing and Rehabilitation Center
- Porter: The Heights on Valley Ranch
- Portland: Avir at Portland
- Post: Post Nursing & Rehab Center
- Princeton: Princeton Medical Lodge
- Quitman: Quitman Wellness & Rehabilitation
- Ralls: Ralls Nursing Home
- Ranger: Premier Health Care Center
- Raymondville: Windsor Nursing and Rehabilitation Center of Raymo
- Red Oak: Red Oak Health and Rehabilitation Center
- Refugio: Mission Ridge Rehab & Nursing Center
- Richland Hills: Avir at Richland Hills
- Richwood: Creekside Village
- Rio Grande City: Rio Grande City Nursing and Rehabilitation Center
- Rio Grande City: Starr County Nursing and Transitional Care
- Rising Star: Rising Star Nursing Center
- Robert Lee: Robert Lee Care Center
- Robstown: Robstown Nursing and Rehabilitation Center
- Rockdale: Rockdale Estates & Rehabilitation
- Rockport: Rockport Nursing and Rehabilitation Center
- Rockport: Gulf Pointe Plaza
- Rosebud: Heritage House Nursing and Rehabilitation
- Rowlett: Rowlett Health and Rehabilitation Center
- Royse City: Royse City Medical Lodge
- Rusk: The Arbors Healthcare and Rehabilitation Center
- Rusk: Cherokee Trails Nursing Home
- Saginaw: The Lodge of Saginaw Health and Wellness
- San Diego: Windsor Nursing and Rehabilitation Center of San D
- San Juan: San Juan Nursing Home, Inc.
- San Saba: San Saba Nursing & Rehabilitation
- Savoy: Mullican Care Center
- Schertz: Silver Tree Nursing and Rehabilitation Center
- Schertz: Avir at Schertz
- Schulenburg: Schulenburg Regency Nursing Center
- Schulenburg: Paradigm at the Oak
- Seagoville: The Manor at Seagoville
- Sealy: Avir at Sealy
- Selma: Trucare Living Centers - Selma
- Seminole: Memorial Health Care Center
- Seymour: Seymour Rehabilitation and Healthcare
- Shavano Park: Estates at Shavano Park
- Shepherd: Woodland Park Nursing & Rehab
- Shiner: Shiner Nursing and Rehabilitation Center
- Slaton: Slaton Care Center
- Smithville: Towers Nursing Home
- Snyder: Avir at Snyder
- Socorro: Las Ventanas De Socorro
- Southlake: The Carlyle at Stonebridge Park
- Southlake: Discovery Village at Southlake
- Spearman: Hansford Manor
- Spring: The Village at Gleannloch Farms
- Spring Branch: The Heights of Bulverde
- Springtown: Springtown Park Rehabilitation and Care Center
- Stamford: Harmony Care at Stamford
- Sterling City: Sterling Nursing and Rehab
- Stratford: Coldwater Manor
- Sweeny: Paradigm at Sweeny
- Sweetwater: Sterling Hills Rehabilitation and Healthcare Cente
- Sweetwater: Avir at Sweetwater
- Taylor: Spjst Rest Home 1
- Teague: Teague Nursing and Rehabilitation
- Trinity: River Pointe of Trinity Healthcare and Rehabilitat
- Trinity: Trinity Rehabilitation & Healthcare Center
- Uvalde: Amistad Nursing and Rehabilitation Center
- Uvalde: Uvalde Healthcare and Rehabilitation Center
- Van: Van Healthcare
- Van Alstyne: Meadowbrook Care Center
- Vernon: Advanced Rehabilitation and Healthcare of Vernon
- Vidor: Oakwood Manor Nursing Home
- Vidor: Vidor Health & Rehabilitation Center
- Watauga: North Pointe Nursing and Rehabilitation
- Weimar: Parkview Manor Nursing and Rehabilitation
- Wellington: Wellington Care Center
- Wells: Wells LTC Nursing & Rehabilitation
- West: West Rest Haven
- Wharton: Paradigm at the Creek
- Wharton: Wharton Nursing and Rehabilitation Center
- Wheeler: Wheeler Nursing & Rehabilitation
- White Settlement: White Settlement Nursing Center
- White Settlement: West Side Campus of Care
- Whitehouse: Oak Brook Health Care Center
- Whitesboro: Whitesboro Health and Rehabilitation Center
- Whitney: Whitney Nursing and Rehabilitation Center
- Willis: Willis Nursing and Rehabilitation
- Willow Park: Willow Park Rehabilitation and Care Center
- Wills Point: Crestwood Health and Rehabilitation Center
- Wimberley: Deer Creek Nursing and Rehabilitation
- Windcrest: Windcrest Nursing and Rehabilitation
- Winnie: Arboretum Nursing and Rehabilitation Center of Win
- Winnsboro: Lakeview Rehabilitation and Healthcare Center
- Winnsboro: Avir at Winnsboro
- Woodville: Woodville Health and Rehabilitation Center
- Woodville: Dogwood Trails Manor
- Wylie: Garnet Hill Rehabilitation and Skilled Care
- Wylie: Wylie Oaks Healthcare and Rehabilitation
- Yoakum: Paradigm at Stevens
- Yoakum: Yoakum Nursing and Rehabilitation Center
- Yorktown: Yorktown Nursing and Rehabilitation Center
- Zapata: Falcon Lake Nursing Home, LLC
Questions about nursing homes in Texas
How many nursing homes are in Texas?
Texas has 1,177 Medicare- or Medicaid-certified nursing homes with 133,481 certified beds in CMS data processed on October 1, 2026.
How many Texas nursing homes have a 5-star overall rating?
165 nursing homes in Texas, 14% of the total, have an overall rating of 5 out of 5. 288 homes have 1 out of 5 and 11 homes have no overall rating.
How does nursing home staffing in Texas compare with the U.S. average?
Nursing homes in Texas report an average of 3.42 hours of nurse staffing per resident per day, against a U.S. average of 3.90, according to CMS. Registered nurses account for 0.44 of those hours in Texas and 0.69 nationally.
How much have Texas nursing homes been fined?
CMS lists 1,678 fines totaling $50,596,177 against 795 nursing homes in Texas, for inspections between October 17, 2023 and September 23, 2026.
Which Texas nursing homes are Special Focus Facilities?
CMS lists 6 Special Focus Facilities in Texas as of October 1, 2026: Coral Rehabilitation and Nursing of Austin in Austin, Harmony Care at Beaumont in Beaumont, Paradigm at Woodwind Lakes in Houston, Terrell Healthcare Center in Terrell, Viridian Wellness & Rehabilitation in Arlington and Woodway Nursing & Rehab in Houston. Another 30 homes are candidates for the program.
Source: Centers for Medicare & Medicaid Services, Provider Data Catalog, Provider Information, Penalties and State US Averages. CMS processed this data on October 1, 2026 and this site copied it on November 22, 2026. It is a snapshot, not a live record: CMS updates ratings about once a month, and Medicare.gov Care Compare has the current ones. How this site uses the data.