Nursing homes in California: CMS ratings
California has 1,165 Medicare- or Medicaid-certified nursing homes with 114,991 certified beds in CMS data processed on October 1, 2026. CMS puts its average overall rating at 3.2 out of 5; the U.S. average is 3.0. 280 homes have the highest overall rating, 5 out of 5, and 179 homes have the lowest, 1 out of 5.
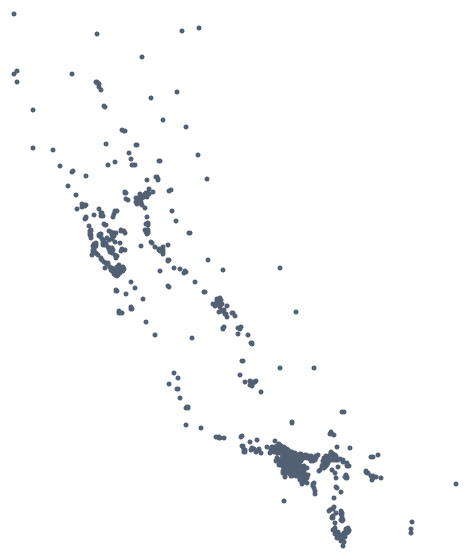
How California nursing homes are rated
- 5 out of 5, much above average 280 (24%)
- 4 out of 5, above average 250 (21%)
- 3 out of 5, average 235 (20%)
- 2 out of 5, below average 210 (18%)
- 1 out of 5, much below average 179 (15%)
- No overall rating 11 (under 1%)
All 280 five-star nursing homes in California
California compared with the U.S.
Averages across all nursing homes, as CMS publishes them in its State US Averages file.
| Measure | California | U.S. |
|---|---|---|
| Overall rating, out of 5 | 3.2 | 3.0 |
| Health inspection rating, out of 5 | 2.8 | 2.8 |
| Staffing rating, out of 5 | 3.3 | 3.0 |
| Quality measure rating, out of 5 | 4.2 | 3.7 |
| Health citations per home in the most recent inspection cycle | 15.7 | 9.2 |
| Fire safety citations per home in the most recent inspection cycle | 6.3 | 4.4 |
| Total nurse staffing, hours per resident per day | 4.54 | 3.90 |
| Registered nurse staffing, hours per resident per day | 0.68 | 0.69 |
| Total nurse staffing on the weekend, hours per resident per day | 4.10 | 3.43 |
| Total nursing staff turnover | 36.6% | 45.3% |
| Registered nurse turnover | 37.8% | 42.5% |
| Average number of residents per day | 87.6 | 85.7 |
| Fines per home | 0.8 | 0.9 |
| Fine amount per home | $23,366 | $30,351 |
CMS bases Five-Star quality ratings in the health inspection domain on the relative performance of facilities within a state.
That makes the health inspection rating, and the overall rating built on it, a comparison between nursing homes in the same state. Ratings in every state.
California nursing homes in numbers
- Nursing homes
- 1,165
- Certified beds
- 114,991
- Residents on an average day
- 101,451
- For profit ownership
- 1,014 (87%)
- Non profit ownership
- 118 (10%)
- Government ownership
- 33 (3%)
- Part of a chain
- 845 (73%)
- Homes fined
- 452 (39%)
- Total fines
- $27,221,500
- Payment denials
- 282
Fines and payment denials are for inspections between October 17, 2023 and September 23, 2026.
Homes with CMS's high-performing icon
151 nursing homes in California have a 5 out of 5 overall rating and CMS's high-performing icon. CMS describes the icon this way: "Exceeds the traditional five-star rating. Higher performing nursing homes have fewer citations (safety violations), higher staffing levels, and other quality indicators." The first 12 by city name are below; the five-star list has them all.
- La Palma Nursing Center
Anaheim, CA
Health inspections 3, staffing 5, quality measures 5. 72 certified beds.
CMS high-performing icon.
- Sun Mar Nursing Center
Anaheim, CA
Health inspections 4, staffing 3, quality measures 5. 69 certified beds.
CMS high-performing icon.
- West Anaheim Medical Center D/P SNF
Anaheim, CA
Health inspections 4, staffing 5, quality measures 5. 28 certified beds.
CMS high-performing icon.
- Lone Tree Post Acute
Antioch, CA
Health inspections 4, staffing 3, quality measures 5. 99 certified beds.
CMS high-performing icon.
- Apple Valley Care Center
Apple Valley, CA
Health inspections 5, staffing 3, quality measures 4. 99 certified beds.
CMS high-performing icon.
- Rock Creek Care Center
Auburn, CA
Health inspections 4, staffing 3, quality measures 5. 84 certified beds.
CMS high-performing icon.
- Siena Skilled Nursing & Rehabilitation Center
Auburn, CA
Health inspections 4, staffing 5, quality measures 4. 107 certified beds.
CMS high-performing icon.
- Victoria Care Center
Baldwin Park, CA
Health inspections 4, staffing 3, quality measures 5. 49 certified beds.
CMS high-performing icon.
- Belmont Healthcare Center
Belmont, CA
Health inspections 5, staffing 3, quality measures 5. 74 certified beds.
CMS high-performing icon.
- Camarillo Healthcare Center
Camarillo, CA
Health inspections 4, staffing 4, quality measures 5. 114 certified beds.
CMS high-performing icon.
- St. John's Hospital Camarillo D/P SNF
Camarillo, CA
Health inspections 5, staffing 4, quality measures 5. 99 certified beds.
CMS high-performing icon.
- Carlsbad by the Sea
Carlsbad, CA
Health inspections 5, staffing 5, quality measures 5. 33 certified beds.
CMS high-performing icon.
Homes CMS has flagged in California
As of October 1, 2026, CMS lists 5 Special Focus Facilities, 30 candidates for that program and 115 homes with its abuse icon in California. What the Special Focus Facility program is.
Special Focus Facilities
- Greenfield Care Center of Fairfield
Fairfield, CA
90 certified beds.
CMS flags: Special Focus Facility
- Mesa Glen Care Center
Glendora, CA
96 certified beds.
CMS flags: Special Focus Facility, Abuse icon
- Sunray Healthcare Center
Los Angeles, CA
99 certified beds.
CMS flags: Special Focus Facility
- Rio Hondo Subacute & Nursing Center
Montebello, CA
200 certified beds.
CMS flags: Special Focus Facility
- Riverside Postacute Care
Riverside, CA
188 certified beds.
CMS flags: Special Focus Facility, Abuse icon
Special Focus Facility candidates
- Burbank Healthcare & Rehab Burbank
- Crescent City Care Center Crescent City
- Golden Pavilion Healthcare Daly City
- Lakewood Healthcare Center Downey
- San Diego Post-Acute Center El Cajon
- Kit Carson Nursing & Rehabilitation Center Jackson
- Antelope Valley Care Center Lancaster
- Mirage Post Acute Lancaster
- Bixby Towers Post-Acute Rehab Long Beach
- Coral Cove Post Acute Long Beach
- Intercommunity Care Center Long Beach
- Avalon Villa Care Center Los Angeles
- California Post-Acute Care Lynwood
- Ararat Nursing Facility Mission Hills
- Four Seasons Healthcare & Wellness Center, LP North Hollywood
- Providence St Elizabeth Care Center North Hollywood
- Dept of State Hospitals - Metropolitan SNF Norwalk
- Novato Healthcare Center Novato
- Majestic Mountain Care Center Oakhurst
- Golden Rose Care Center Pasadena
- Inland Valley Care and Rehabilitation Center Pomona
- Shasta View Care Center Red Bluff
- Santa Monica Rehabilitation Center Santa Monica
- Imperial Care Center Studio City
- Studio City Rehabilitation Center Studio City
- Astoria Healthcare Center Sylmar
- Maclay Healthcare Center Sylmar
- Santa Anita Convalescent Hospital Temple City
- Bay Crest Care Center Torrance
- Sunnyside Nursing Center Torrance
Homes with the abuse icon
CMS's definition: "Cited for abuse or neglect at harm level or above on survey cycle 1 (Scope/severity G or greater) or cited for abuse or neglect at potential harm level (Scope/Severity D or above) on both survey cycles 1 and 2."
- Alameda Hospital D/P SNF Alameda
- Bay View Rehabilitation Hospital, LLC Alameda
- Artesia Palms Care Center Artesia
- Westview Healthcare Center Auburn
- Bayshire Riverwalk Post-Acute Bakersfield
- Burbank Healthcare & Rehab Burbank
- River City Post Acute Carmichael
- River Pointe Post-Acute Carmichael
- Seneca District Hospital D/P SNF Chester
- Autumn Creek Post Acute Chico
- Oakwood Healthcare Center Chico
- Meadowood Nursing Center Clearlake
- Coalinga Regional Medical Ctr Dp/Snf Coalinga
- Santa Fe Heights Healthcare Center, LLC Compton
- Bayberry Skilled Nursing & Healthcare Center Concord
- Concord Post Acute Concord
- Diablo Valley Post Acute Concord
- Courtyard Health Care Center Davis
- Lakewood Healthcare Center Downey
- Magnolia Post Acute Care El Cajon
- San Diego Post-Acute Center El Cajon
- Eastland Subacute and Rehabilitation Center El Monte
- Elk Grove Post Acute Elk Grove
- Fortuna Rehabilitation and Wellness Center, LP Fortuna
- Rancho Seco Care Center Galt
- Las Flores Convalescent Hospital Gardena
- Chestnut Ridge Post Acute LLC Glendale
- Griffith Park Healthcare Center Glendale
- Mesa Glen Care Center Glendora
- Emmanuel Post Acute Care - Hayward Hayward
- Sierra Vista Highland
- Rocky Point Care Center Lakeport
- Antelope Valley Care Center Lancaster
- Lawndale Healthcare & Wellness Centre LLC Lawndale
- Intercommunity Care Center Long Beach
- Long Beach Care Center, Inc Long Beach
- Long Beach Healthcare Center Long Beach
- North Long Beach Post Acute Long Beach
- Pacific Villa, Inc Long Beach
- Hyde Park Healthcare Center Los Angeles
- Infinity Care of East Los Angeles Los Angeles
- Kei-Ai Los Angeles Healthcare Center Los Angeles
- La Brea Rehabilitation Center Los Angeles
- Maple Healthcare Center Los Angeles
- Meadowbrook Behavioral Health Center Los Angeles
- Miracle Mile Healthcare Center, LLC Los Angeles
- Oceana Healthcare Center Los Angeles
- Olympia Convalescent Hospital Los Angeles
- University Park Healthcare Center Los Angeles
- Vernon Healthcare Center Los Angeles
- Westwood Post Acute Care Los Angeles
- Harvest Crossing Post Acute Manteca
- Ararat Nursing Facility Mission Hills
- Newport Nursing and Rehabilitation Center Newport Beach
- Pelican Ridge Post Acute Newport Beach
- Four Seasons Healthcare & Wellness Center, LP North Hollywood
- Valley Vista Nursing and Transitional Care LLC North Hollywood
- Dept of State Hospitals - Metropolitan SNF Norwalk
- Studebaker Healthcare Center Norwalk
- Novato Healthcare Center Novato
- Majestic Mountain Care Center Oakhurst
- Garfield Neurobehavioral Center Oakland
- Feather River Care Center Oroville
- Oroville Hospital Post-Acute Center Oroville
- Desert Springs Post Acute Palm Desert
- La Paz Geropsychiatric Center Paramount
- Cedar Pine Post Acute Pasadena
- Pasadena Nursing Center Pasadena
- North Bay Post Acute Petaluma
- Chino Valley Health Care Cente Pomona
- Inland Valley Care and Rehabilitation Center Pomona
- Landmark Medical Center Pomona
- Park Avenue Healthcare & Wellness Center Pomona
- Crestwood Wellness and Recovery Center Redding
- Riverside Postacute Care Riverside
- Roseville Care Center Roseville
- Roseville Point Health & Wellness Center Roseville
- Arden Park Post Acute Sacramento
- Bridgewood Post Acute Sacramento
- Bruceville Terrace - D/P SNF of Methodist Hospital Sacramento
- Capital Post Acute Sacramento
- Double Tree Post Acute Care Center Sacramento
- Gramercy Court Sacramento
- Greenhaven Healthcare Center Sacramento
- North Pointe Care Center Sacramento
- St. Pauls Health Care Center San Diego
- Live Oak Rehab Center San Gabriel
- San Marino Healthcare Center San Gabriel
- Creekside Healthcare Center San Pablo
- White Point Care Center San Pedro
- Marin Post Acute San Rafael
- Northgate Postacute Care San Rafael
- Pine Ridge Care Center San Rafael
- Plaza Healthcare Center Santa Ana
- South Coast Post Acute Santa Ana
- Berkley East Healthcare Center Santa Monica
- Blue Oak Post-Acute Santa Rosa
- Park View Post Acute Santa Rosa
- Edgemoor Hospital Santee
- Valley of the Moon Post Acute Sonoma
- Greenfield Care Center of South Gate South Gate
- Brookside Care Center Stockton
- Delta Oaks Post Acute Stockton
- Hampton Post Acute Stockton
- Noble Care Center Stockton
- Oak Grove Post Acute Stockton
- Sunland Post Acute Sunland
- Lassen Nursing & Rehabilitation Center Susanville
- Tarzana Health and Rehabilitation Center Tarzana
- Sherwood Oaks Post Acute Thousand Oaks
- Bay Crest Care Center Torrance
- North Valley Nursing Center Tujunga
- West Valley Post Acute West Hills
- The Grove Post-Acute Woodland
- Bridgeview Post Acute Yuba City
Cities in California
Cities with three or more nursing homes, with the number in each.
- Alameda 5
- Alhambra 5
- Anaheim 14
- Auburn 5
- Bakersfield 10
- Baldwin Park 4
- Bell Gardens 3
- Bellflower 4
- Berkeley 5
- Camarillo 3
- Campbell 3
- Canoga Park 4
- Carlsbad 3
- Carmichael 8
- Castro Valley 5
- Chico 5
- Chula Vista 3
- Claremont 3
- Concord 5
- Corona 3
- Costa Mesa 3
- Covina 5
- Culver City 3
- Cupertino 3
- Daly City 3
- Delano 3
- Downey 4
- Duarte 4
- El Cajon 12
- El Monte 11
- Encinitas 3
- Escondido 7
- Eureka 3
- Fairfield 4
- Fremont 7
- Fresno 19
- Fullerton 7
- Garden Grove 6
- Gardena 8
- Glendale 13
- Glendora 5
- Granada Hills 4
- Grass Valley 4
- Hanford 3
- Hawthorne 3
- Hayward 16
- Hemet 7
- Huntington Beach 3
- Inglewood 5
- La Mesa 8
- Laguna Hills 3
- Lancaster 4
- Livermore 3
- Lodi 5
- Loma Linda 3
- Long Beach 25
- Los Angeles 78
- Los Gatos 4
- Lynwood 3
- Merced 6
- Modesto 9
- Monterey 4
- Mountain View 3
- Napa 5
- National City 5
- Newport Beach 3
- North Hollywood 7
- Norwalk 7
- Oakland 18
- Ontario 4
- Orange 5
- Oroville 3
- Oxnard 4
- Pacific Grove 3
- Palm Desert 3
- Palm Springs 4
- Palo Alto 3
- Paramount 3
- Pasadena 13
- Petaluma 5
- Pico Rivera 4
- Placerville 3
- Pomona 9
- Porterville 5
- Poway 3
- Redding 8
- Redlands 7
- Reedley 3
- Reseda 5
- Riverside 18
- Rosemead 5
- Roseville 4
- Sacramento 23
- Salinas 5
- San Bernardino 11
- San Diego 21
- San Francisco 18
- San Gabriel 7
- San Jose 19
- San Leandro 7
- San Luis Obispo 3
- San Pablo 3
- San Pedro 3
- San Rafael 7
- Santa Ana 8
- Santa Barbara 7
- Santa Cruz 3
- Santa Maria 4
- Santa Monica 12
- Santa Rosa 7
- Saratoga 3
- Sonoma 3
- Spring Valley 3
- Stockton 14
- Sun Valley 3
- Sunland 3
- Sunnyvale 4
- Sylmar 4
- Temple City 3
- Thousand Oaks 3
- Torrance 12
- Tulare 3
- Turlock 4
- Upland 3
- Vallejo 3
- Van Nuys 6
- Ventura 3
- Victorville 3
- Visalia 6
- Vista 3
- Walnut Creek 6
- Watsonville 3
- West Covina 5
- Westminster 3
- Whittier 7
- Woodland 3
- Yuba City 3
- Yucaipa 3
Other cities and towns
Places with one or two nursing homes, listed by place name.
- Alta Loma: Rancho Mesa Care Center
- Alturas: Modoc Medical Center D/P SNF
- Anderson: Oak River Rehab
- Antioch: Lone Tree Post Acute
- Antioch: Delta View Post Acute
- Apple Valley: Apple Valley Care Center
- Arcadia: Huntington Drive Health and Rehabilitation Center
- Arcadia: Arcadia Care Center
- Arroyo Grande: Arroyo Grande Care Center
- Artesia: Artesia Christian Home Inc.
- Artesia: Artesia Palms Care Center
- Arvin: Arvin Post Acute
- Atascadero: Coastal Oaks Special Care Center
- Atwater: Anberry Nursing and Rehabilitation Center
- Avalon: Catalina Island Health
- Banning: Sundance Creek Post Acute
- Banning: Sunrise Post Acute
- Barstow: Mountain View Post Acute
- Barstow: Veterans Home Of California - Barstow
- Beaumont: Highland Springs Care Center
- Beaumont: Vista Real Post Acute
- Bell: Bell Convalescent Hospital
- Belmont: Belmont Healthcare Center
- Big Bear Lake: Bear Valley Community Hospital D/P SNF
- Bishop: Bishop Care Center
- Blythe: Blythe Post Acute LLC
- Brawley: Pioneers Memorial Skilled Nursing Center
- Brea: Kindred Hospital Brea D/P SNF
- Buena Park: Buena Park Nursing Center
- Buena Park: Healthcare Center of Orange County
- Burbank: Burbank Healthcare & Rehab
- Burbank: Alameda Care Center
- Burlingame: Peninsula Post-Acute
- Capitola: Pacific Coast Manor
- Cedarville: Surprise Valley Community Hospital D/P SNF
- Ceres: Ceres Postacute Care
- Chatsworth: Chatsworth Park Health Care Center
- Chatsworth: Stoney Point Healthcare Center
- Cherry Valley: Oak Glen Post Acute
- Chester: Seneca District Hospital D/P SNF
- Chino: Trellis Chino
- Chowchilla: Palms Care Center
- Chowchilla: Chowchilla Memorial Healthcare District
- Citrus Heights: Citrus Heights Post Acute
- City of Industry: El Encanto Healthcare Center
- Clearlake: Meadowood Nursing Center
- Cloverdale: Cloverdale Healthcare Center
- Clovis: Morning Star Post Acute
- Clovis: Willow Creek Healthcare Center
- Coalinga: Coalinga Regional Medical Ctr Dp/Snf
- Colton: Meadows Ridge Care Center
- Colton: The Canyons Post-Acute
- Colusa: Colusa Medical Center - SNF
- Compton: Santa Fe Heights Healthcare Center, LLC
- Coronado: Villa Coronado D/P SNF
- Crescent City: Crescent City Care Center
- Dana Point: Capistrano Beach Care Center
- Danville: The Reutlinger Community
- Danville: Danville Post-Acute Rehab
- Davis: Courtyard Health Care Center
- Davis: University Retirement Community at Davis
- Dinuba: Dinuba Healthcare
- El Centro: El Centro Post-Acute Care
- El Cerrito: Shields Nursing Center
- El Sobrante: Greenridge Post Acute
- Elk Grove: Elk Grove Post Acute
- Encino: Encino Hospital Medical Center D/P SNF
- Fair Oaks: Fair Oaks Healthcare Center
- Fall River Mills: Mayers Memorial Hospital
- Fallbrook: Fallbrook Skilled Nursing
- Fillmore: Greenfield Care Center of Fillmore, LLC
- Folsom: Folsom Care Center
- Fontana: Citrus Nursing Center
- Fontana: Laurel Convalescent Hospital
- Fort Bragg: Sherwood Oaks Post Acute Care, LLC
- Fortuna: Fortuna Rehabilitation and Wellness Center, LP
- Fountain Valley: Fountain Valley Post Acute
- Fowler: Vineyards at Fowler
- Fowler: Fowler Care Center
- Galt: Rancho Seco Care Center
- Garberville: Jerold Phelps Comm Hosp SNF
- Gilroy: Gilroy Healthcare Center
- Grand Terrace: Grand Terrace Health Care Center
- Greenbrae: South Marin Health & Wellness Center
- Greenbrae: The Tamalpais
- Gridley: Gridley Post Acute
- Healdsburg: Healdsburg Hospital D/P SNF
- Highland: Highland Palms Healthcare Center
- Highland: Sierra Vista
- Hollister: Hazel Hawkins Memorial Hospital D/P SNF
- Huntington Park: Huntington Park Nursing Center
- Imperial: Imperial Manor
- Indio: Desert Springs Healthcare & Wellness Centre
- Indio: Desert Mountain Care Center
- Irvine: Regents Point - Windcrest
- Jackson: Kit Carson Nursing & Rehabilitation Center
- Joshua Tree: Hi-Desert Medical Center D/P SNF
- Jurupa Valley: Vista Pacifica Convalescent Hospital
- Jurupa Valley: Vista Pacifica Center
- King City: George L Mee Memorial Hospital D/P SNF
- Kingsburg: Kingsburg Center
- La Crescenta: La Crescenta Healthcare Center
- La Habra: Bonita Hills Post Acute
- La Habra: Park Regency Care Center
- La Jolla: La Jolla Post-Acute
- La Jolla: The Cove at La Jolla
- La Mirada: Sunny Hills Post Acute
- La Mirada: Imperial Healthcare Center
- La Verne: Woods Health Services
- Lake Arrowhead: Mountains Community Hosp DP/SNF
- Lake Forest: Trabuco Hills Post Acute
- Lake Forest: Freedom Village Healthcare Center
- Lake Isabella: Kern Valley Healthcare District DP SNF
- Lake View Terrace: Country Manor Healthcare
- Lakeport: Rocky Point Care Center
- Lakeport: Lakeport Post Acute
- Lakeside: Lakeside Special Care Center
- Lawndale: Lawndale Healthcare & Wellness Centre LLC
- Lemon Grove: Lemon Grove Care and Rehabilitation Center
- Lemon Grove: Bella Vista Health Center
- Lincoln: Lincoln Meadows Care Center
- Lindsay: Lindsay Gardens Nursing & Rehabilitation
- Live Oak: River Valley Care Center
- Livingston: Grace Home Inc.
- Lomita: Lomita Post-Acute Care Center
- Lomita: Palos Verdes Health Care Center
- Lompoc: Lompoc Valley Medical Center Comprehensive Care Ce
- Lompoc: Lompoc Skilled Nursing & Rehabilitation Center
- Lone Pine: Southern Inyo Hospital D/P SNF
- Los Alamitos: Alamitos West Health & Rehabilitation
- Los Altos: The Terraces at Los Altos Health Facility
- Los Altos: Los Altos Post-Acute
- Los Banos: Los Banos Post Acute
- Los Banos: New Bethany Skilled Nursing
- Madera: Madera Rehabilitation & Nursing Center
- Madera: Madera Care Center
- Manteca: Harvest Crossing Post Acute
- Manteca: Guardian Care and Rehabilitation Center
- Mariposa: John C. Fremont Healthcare District Dp/Snf
- Martinez: Alhambra Post Acute
- Martinez: Legacy Post Acute Care
- Marysville: Marysville Post-Acute
- Maywood: Maywood Skilled Nursing & Wellness Centre
- Menlo Park: Atherton Park Post-Acute
- Mentone: University Post Acute
- Mill Valley: The Redwoods, a Community of Seniors
- Millbrae: Millbrae Care Center
- Milpitas: Milpitas Care Center
- Mission Hills: Providence Holy Cross Med Ctr D/P SNF
- Mission Hills: Ararat Nursing Facility
- Monrovia: Monrovia Gardens Healthcare Center
- Montclair: Montclair Manor Care Center
- Montclair: Community Extended Care Hospital Of Montclair
- Montebello: Montebello Care Center
- Montebello: Rio Hondo Subacute & Nursing Center
- Monterey Park: Monterey Park Conv Hosp
- Monterey Park: Heritage Manor
- Montrose: Montrose Healthcare Center
- Montrose: Montrose Springs Skilled Nursing & Wellness Center
- Moraga: Moraga Post Acute
- Moreno Valley: Rancho Bellagio Post Acute
- Morgan Hill: Pacific Hills Post Acute
- Morgan Hill: Morgan Hill Healthcare Center
- Morro Bay: Bayside Care Center
- Murrieta: Murrieta Health and Rehabilitation Center
- Murrieta: The Springs Health and Rehabilitation Center
- N Hollywood: Valley Palms Care Center
- Newbury Park: Mary Health of the Sick Convalescent & Nursing Hos
- Newhall: Santa Clarita Post-Acute Care Center
- Newman: San Luis Care Center
- North Hills: The Rehabilitation Center of North Hills
- Northridge: The Gardens Healthcare Center
- Novato: Novato Healthcare Center
- Oakdale: Oakdale Nursing and Rehabilitation Center
- Oakhurst: Majestic Mountain Care Center
- Oceanside: La Paloma Healthcare Center
- Oceanside: Pacific Villas Post Acute
- Ojai: Ojai Health & Rehabilitation
- Ojai: Community Memorial Continuing Care Center
- Orinda: Orinda Care Center, LLC
- Pacifica: Linda Mar Care Center
- Pacifica: Pacifica Nursing and Rehabilitation Center
- Panorama City: The Meadows Post Acute
- Panorama City: Panorama Gardens Nursing and Rehabilitation Center
- Perris: Centinela Grand Inc
- Pittsburg: Pittsburg Skilled Nursing Center
- Pittsburg: Diamond Ridge Healthcare Center
- Playa Del Rey: Playa Del Rey Center
- Pleasant Hill: Pleasant Hill Post Acute
- Pleasant Hill: Rosewood Post Acute
- Pleasanton: Pleasanton Nursing and Rehabilitation Center
- Pleasanton: Creekview Skilled Nursing
- Portola: Eastern Plumas Hospital- Portola Campus Dp/Snf
- Portola Valley: The Sequoias
- Quincy: Plumas District Hospital Dp/Snf
- Rancho Cordova: Casa Coloma Health Care Center
- Rancho Mirage: Rancho Mirage Health and Rehabilitation Center
- Rancho Mirage: Bayshire Rancho Mirage
- Rancho Mission Viejo: Orchards Skilled Nursing
- Red Bluff: Shasta View Care Center
- Red Bluff: Red Bluff Health Care Center
- Redwood City: Devonshire Oaks Nursing Center
- Rialto: Rialto Post Acute Center
- Richmond: Shields Richmond Nursing Center
- Richmond: Richmond Post Acute Care
- Ridgecrest: Ridgecrest Regional Transitional Care and Rehabili
- Ripon: Bethany Home Society San Joaquin County
- Riverbank: Riverbank Post-Acute
- San Andreas: Golden San Andreas Care Center
- San Bruno: San Bruno Skilled Nursing
- San Dimas: Casa Bonita Convalescent Hospital
- San Dimas: Bayshire San Dimas Post-Acute
- San Jacinto: The Bradley Gardens
- San Juan Capistrano: San Juan Hills Healthcare Center
- San Marcos: Village Square Healthcare Center
- San Mateo: Brookside Skilled Nursing Hospital
- San Mateo: San Mateo Medical Center D/P SNF
- Sanger: Cornerstone Care Center
- Santa Clara: The Win Post-Acute
- Santa Clara: Santa Clara Post Acute
- Santa Paula: Santa Paula Post Acute Center
- Santee: Edgemoor Hospital
- Santee: Stanford Court Skilled Nursing & Rehab Center
- Seal Beach: Seal Beach Health and Rehabilitation Center
- Sebastopol: Apple Valley Post-Acute Rehab
- Selma: Rolling Hills Care Center
- Selma: Bethel Lutheran Home
- Shafter: Shafter Nursing Care
- Sherman Oaks: Sherman Oaks Health & Rehab
- Sherman Oaks: Sherman Oaks Hospital SNF DP
- Signal Hill: Courtyard Care Center
- Simi Valley: Simi Healthcare Center
- Soledad: Eden Valley Care Center
- Solvang: Atterdag Care Center
- Sonora: Adventist Health Sonora - D/P SNF
- Sonora: Golden Sonora Care Center
- South Gate: Greenfield Care Center of South Gate
- South Lake Tahoe: Barton Hospital D/P SNF
- South Pasadena: South Pasadena Care Center
- Stanton: Rowntree Gardens
- Studio City: Studio City Rehabilitation Center
- Studio City: Imperial Care Center
- Sun City: Menifee Lakes Post Acute
- Susanville: Lassen Nursing & Rehabilitation Center
- Tarzana: Tarzana Health and Rehabilitation Center
- Temecula: Temecula Healthcare Center
- Templeton: Vineyard Hills Health Center
- Tracy: Tracy Nursing and Rehabilitation Center
- Tracy: North Park Post-Acute
- Truckee: Tahoe Forest Hospital D/P SNF
- Tujunga: North Valley Nursing Center
- Tujunga: Oakpark Healthcare Center
- Tustin: Foothill Regional Medical Center D/P SNF
- Ukiah: Ukiah Post Acute
- Ukiah: Redwood Cove Healthcare Center
- Union City: Masonic Home
- Vacaville: Vacaville Ranch Post Acute
- Vacaville: Vacaville Convalescent and Rehabilitation Center
- Weaverville: Trinity Hospital Skilled Nursing Facility
- Weed: Shasta Healthcare
- West Hills: West Valley Post Acute
- West Sacramento: River Bend Nursing Center
- Williams: Almond View Care Center
- Willits: Northbrook Healthcare Center
- Willows: Willows Post Acute
- Woodland Hills: Motion Picture and T.V. Hosp D/P SNF
- Yorba Linda: Bayshire Yorba Linda Post-Acute
- Yountville: Veterans Home of California - Yountville - SNF
- Yucca Valley: Joshua Tree Post Acute
- Yucca Valley: Indian Canyon Post Acute
Questions about nursing homes in California
How many nursing homes are in California?
California has 1,165 Medicare- or Medicaid-certified nursing homes with 114,991 certified beds in CMS data processed on October 1, 2026.
How many California nursing homes have a 5-star overall rating?
280 nursing homes in California, 24% of the total, have an overall rating of 5 out of 5. 179 homes have 1 out of 5 and 11 homes have no overall rating.
How does nursing home staffing in California compare with the U.S. average?
Nursing homes in California report an average of 4.54 hours of nurse staffing per resident per day, against a U.S. average of 3.90, according to CMS. Registered nurses account for 0.68 of those hours in California and 0.69 nationally.
How much have California nursing homes been fined?
CMS lists 886 fines totaling $27,221,500 against 452 nursing homes in California, for inspections between October 17, 2023 and September 23, 2026.
Which California nursing homes are Special Focus Facilities?
CMS lists 5 Special Focus Facilities in California as of October 1, 2026: Greenfield Care Center of Fairfield in Fairfield, Mesa Glen Care Center in Glendora, Rio Hondo Subacute & Nursing Center in Montebello, Riverside Postacute Care in Riverside and Sunray Healthcare Center in Los Angeles. Another 30 homes are candidates for the program.
Source: Centers for Medicare & Medicaid Services, Provider Data Catalog, Provider Information, Penalties and State US Averages. CMS processed this data on October 1, 2026 and this site copied it on November 22, 2026. It is a snapshot, not a live record: CMS updates ratings about once a month, and Medicare.gov Care Compare has the current ones. How this site uses the data.